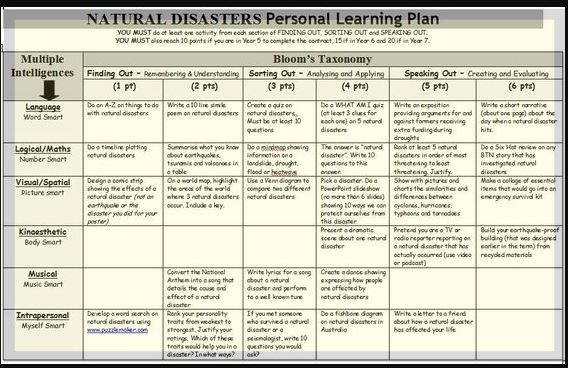
Differentiation Grid

Basic Strategy
The differentiation grid is a simple, two-dimensional table divided into rows and columns that helps the student think through the differences in 2-3 disease presentations.
The grid is used to organize information and identify relationships. Some cells in the grid are intentionally left blank where students are asked to fill in the blank cells, demonstrating their understanding of the content. There is moderate investment of time required on behalf of faculty to create the grid and then analyze the results.
Why would you use?
The technique provides a structure for students to organize and synthesize complicated information. This exercise works well with large amounts of content and can simplify complex, dynamic systems of information. Faculty can identify prior or incorrect knowledge.
When can you use?
Differentiation Grid is simple to implement and easy to use during instruction however there is some up-front preparation that must be completed. Consider content carefully. Content needs to appropriately align with column and row organization. This exercise is effective after lectures, videos, reading assignments, etc.
How does it work?
- Carefully choose your content topic. Make sure the content can be organized in a grid with rows and columns.
- Create a blank grid for students to fill in.
- Explain the purpose of the exercise.
- Let students know how much time they will have, what kinds of responses you are looking for (words, bullets, short sentences), and when they can expect feedback.
- Handout blank or partially filled grid. Have students work on in class, individually or in groups. Provide an example grid if this is the first time you are presenting a differentiation grid.
- Students complete the grid and hand-in.
- Review and analyze results
- Analysis: Scan the completed grids and compare to your key grid for correct responses vs incorrect responses - focus on patterns in the responses.
- Results: Record the number of each correct or incorrect response into a spreadsheet or Canvas gradebook where data can be reported in a variety of methods. Look for common misconceptions or errors. This could indicate recall problems, difficultly categorizing information, or insufficient teaching focus on a particular topic or category.
- Provide feedback and clear misconceptions at next class meeting.
Technology based options
Use a spreadsheet to have small groups or individuals fill cells.